Open Nav


When engineering teams evaluate Electronics Manufacturing services, they usually start with unit pricing. The quote says $12.50 per board, and the calculation seems straightforward: multiply by volume, add components, and compare against other vendors. Three months into production, the real cost picture emerges—and it rarely matches the initial projection.
Hidden costs erode savings that looked promising on spreadsheets. NRE charges, rework expenses, expediting fees, and inventory carrying costs compound quietly until a quarterly review reveals that the "cheapest" vendor delivered the most expensive outcome. Understanding what actually drives Manufacturing cost requires looking beyond the line-item quote into the systems, decisions, and tradeoffs that determine Total Cost Of Ownership.
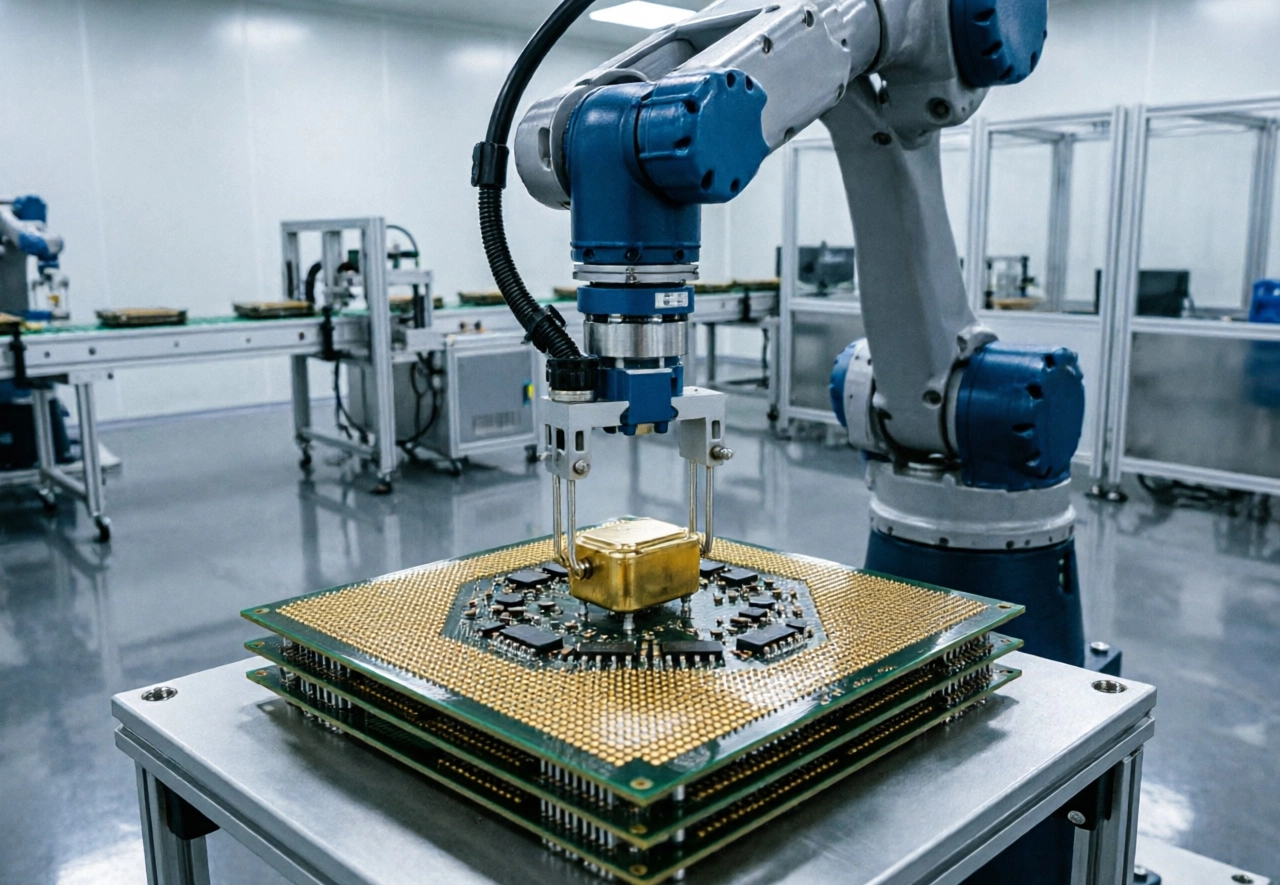
Unit pricing tells you what each finished board costs. It tells you almost nothing about what each board actually costs to produce. A vendor quoting $10 per board might have astronomical setup costs that get amortized across a small initial run. Another at $13 per board might include comprehensive testing, incoming inspection, and drop-shipping that eliminates your downstream handling costs.
The assembly quote you're comparing might exclude PCB Fabrication, Component Procurement, engineering changes, first-article inspection, packaging, or freight. Every excluded line item appears later as an add-on charge. A complete cost comparison requires understanding exactly what each quote includes—and negotiating a scope that matches across all bidders.
Volume assumptions also distort comparisons. The $10 per board quote might be valid only at 5,000 units per month. Drop to 1,000 units and the price jumps to $16. Scale to 20,000 units and it falls to $8.50. Without mapping quotes to your actual production volumes, comparison shopping produces false confidence in pricing that doesn't survive contact with your real demand profile.
Non-recurring engineering charges cover the one-time work required to prepare your product for Manufacturing. This includes stencil fabrication, fixture building, test program development, Dfm Review, first-article documentation, and the engineering time to debug initial builds. NRE can range from a few hundred dollars for simple boards to tens of thousands for complex assemblies with custom test systems.
Setup costs are particularly volatile for low-to-medium volume production. When your EMS partner fires up a production line for your job, they incur labor costs for line setup, material staging, and program loading regardless of how many boards roll off the line. Those setup costs get amortized across your production run, which means a 50-board prototype run carries the same setup cost as a 500-board spin. The per-board impact of setup costs is inversely proportional to order size—a dynamic that surprises teams used to pricing at high volumes.
Stencil costs deserve particular attention. Precision stencils for fine-pitch assemblies cost $150-400 typically, but specialized stencils for ultra-fine-pitch Bga work or flex circuits can exceed $1,000. Multiple stencil revisions during development multiply these costs. When you're iterating rapidly on a new product, stencil expenses accumulate faster than most engineers anticipate.
Component pricing varies more than most buyers realize. The same MCP2515 CAN controller from the same distributor carries different pricing depending on order size, lead time, and whether you're buying a reel, cut tape, or partial reel. EMS providers with strong distributor relationships negotiate volume pricing that smaller buyers can't access, but the savings don't automatically flow through to your quoted component costs.
Obsolescence management represents an invisible cost that only becomes visible after it causes problems. Components go obsolete without warning. Datasheets get revised with last-time-buy dates buried in vendor emails. When a critical part disappears from the Supply Chain, the emergency search for alternatives, requalification testing, and potential redesign work can cost more than the original component savings ever provided.
Component lead time volatility creates expediting costs that distort actual pricing. When market demand spikes for microcontrollers or power semiconductors, standard lead times stretch from weeks to months. Teams facing product launch deadlines pay premium prices and freight costs to secure parts faster. A manufacturing quote built on standard lead times becomes irrelevant when your actual Supply Chain requires emergency sourcing.
Minimum order quantities frequently force component purchases that exceed your immediate needs. A chip with 3,000-unit MOQ purchased for a 500-unit first order leaves you holding 2,500 units of expensive inventory. The carrying cost of that inventory—financing, storage, insurance, and eventual write-off if the design changes—often exceeds the unit price savings from volume purchasing.
Assembly labor is visible, but manufacturing engineering labor is often the larger invisible cost. Every board that fails testing requires engineering time to diagnose the root cause. When yield drops unexpectedly, engineers spend hours tracing problems through the build process. This diagnostic labor adds to your per-board cost, particularly for complex boards with marginal designs that produce intermittent failures.
Rework labor is perhaps the most painful hidden cost. A board with a single defective component requires a technician to desolder the part, clean the joint, install a replacement, and verify the fix. Each rework operation takes 15-30 minutes for surface mount parts, longer for multi-pin packages. Rework on buried BGAs or complex QFNs requires specialized skills that command premium labor rates. Rework costs don't appear in quotes because they depend on defect rates your design hasn't yet revealed.
Documentation and quality engineering labor also contribute to the total cost. Certificate of conformance generation, lot traceability documentation, first-article inspection reports, and ISO/AS9100 quality records require administrative effort. For regulated industries, the documentation burden can exceed the direct manufacturing cost for small batches.
Test coverage is one of the most consequential cost decisions in Electronics Manufacturing. In-circuit test (ICT) catches manufacturing defects but requires bed-of-nails fixtures that cost $5,000-30,000 depending on board complexity. Flying probe testing avoids fixture costs but runs slower, making it economical only for small volumes or prototypes.
Functional test requirements vary enormously across products. A simple LED driver might need only Visual Inspection and basic continuity checks. A complex medical device requires full functional verification under multiple operating conditions, potentially including burn-in testing that runs boards for hours at temperature extremes. Functional test development can rival or exceed Nre Costs for complex products, and ongoing test execution adds significant per-board labor.
Boundary Scan JTAG testing provides an alternative for boards with high pin-count components where physical probe access is impractical. JTAG adds development cost but can reduce ICT fixture complexity and improve defect coverage for complex digital assemblies. The tradeoffs depend heavily on your specific board's component mix and defect modes.
Missing test coverage creates downstream costs that don't appear in manufacturing quotes. Boards that pass assembly test but fail in system integration burn engineering time debugging problems that better manufacturing test would have caught. Field failures that result from untested defect modes carry warranty costs, customer relationship damage, and potential liability exposure that vastly exceed the testing expense that could have prevented them.
Freight costs accumulate silently through production. Components ship from distributors to the EMS facility. Finished boards ship to your warehouse or directly to customers. Each shipment incurs freight charges that seem trivial in isolation but compound across multiple production runs and shipments. Air freight for expedited orders costs 5-10x standard ground shipping—emergency situations that could have been avoided with better planning often generate thousands in unplanned freight charges.
Packaging requirements affect both cost and quality. Standard anti-static bags work for most assemblies, but products destined for harsh environments or retail channels require specialized packaging that protects during distribution. A product that arrives damaged due to inadequate packaging generates warranty claims, return processing costs, and reputation damage that exceed the packaging upgrade that could have prevented the problem.
Inventory carrying costs deserve explicit attention in cost analysis. Components or finished boards sitting in warehouses represent capital that's not generating returns. The true cost of inventory includes not just storage fees but the opportunity cost of capital, insurance against obsolescence, and administrative overhead for Inventory Management. A just-in-time manufacturing approach minimizes carrying costs but increases vulnerability to supply disruptions and expedited shipping needs.
Design decisions made months before manufacturing begins determine production costs for the product's entire lifetime. Component packages that are difficult to place—fine-pitch QFNs, ultra-small passives,damp-sensitive packages—require slower pick-and-place speeds and more frequent assembly defects. The per-board labor cost difference between easy and difficult components can exceed 30%.
Via-in-pad and other advanced Pcb features allow dense, high-performance designs but complicate assembly. Solder filling of via-in-pad adds process steps that increase cost and reduce first-pass yield. Blind and buried vias multiply PCB Fabrication cost substantially compared to through-hole-only designs. The performance benefits of advanced features must be weighed against their manufacturing cost premiums.
Panel utilization—the percentage of each Pcb panel devoted to your product versus waste material—directly affects your board cost. A design that fits two boards per panel effectively doubles your unit board cost compared to an equivalent design that fits four boards per panel in the same panel size. Design teams optimizing purely for performance sometimes overlook panelization efficiency, generating unnecessary manufacturing cost.
Manufacturing location affects cost structure in ways that extend beyond labor rates. Shipping distance, duty tariffs, and import/export regulations all factor into landed cost. A component sourced from a distributor in Singapore, manufactured in Vietnam, and shipped to California carries different cost structure than the same product made in Mexico.
Currency volatility creates cost uncertainty that unit pricing doesn't capture. A manufacturing quote in dollars today reflects current exchange rates. If your EMS partner's costs are in another currency, rate fluctuations shift their actual costs between quote and delivery. Long-term production agreements often include currency adjustment mechanisms, but the protections aren't always complete or automatic.
Local support proximity matters for cost too. An offshore manufacturer with excellent pricing may require weeks to respond to urgent quality issues, while a local manufacturer can send engineers to your site within hours. The cost of delayed responses—production holds, missed delivery commitments, expedited reworks—sometimes exceeds any pricing advantage from distant manufacturing.
Quality costs organize into a hierarchy that illustrates why prevention pays better than detection. Appraisal costs—inspection, testing, auditing—represent the visible quality expense. Failure costs—rework, scrap, returns, warranty—are more visible but represent a fraction of true quality-related costs. The largest quality cost category is often internal failures: production delays, expediting, engineering time on yield problems—that never appear in cost reports because they're absorbed into overhead.
Field failure costs dwarf manufacturing-level quality expenses. A board that fails after customer deployment triggers warranty processing, potentially field repair or replacement, engineering investigation, corrective action implementation, and customer relationship management. For high-reliability products, a single field failure can cost more than the entire NRE investment for the project.
The economic choice isn't always the highest quality level. Products with low failure consequences and acceptable repair costs can tolerate higher defect rates than medical devices or safety-critical systems. Matching quality investment to actual failure consequence creates appropriate cost/quality balance rather than uniformly maximizing or minimizing quality spending.
Comprehensive manufacturing cost analysis requires modeling beyond unit pricing. A complete cost model should include NRE amortized across expected production volume, component costs including excess inventory provisions, yield-adjusted assembly cost, test cost per good board, logistics and packaging, quality-related costs at realistic defect rates, and risk provisions for supply chain volatility.
Life-cycle cost modeling extends the analysis further. Design maintenance costs, product upgrade expenses, obsolescence-driven redesigns, and field support burden all contribute to Total Cost Of Ownership. Products designed with manufacturing flexibility—accessible components, modular architecture, standard interfaces—reduce life-cycle costs even when they increase initial manufacturing expense.
Scenario analysis reveals cost sensitivity to volume changes, mix shifts, and market disruptions. Running your cost model against optimistic, expected, and pessimistic production scenarios shows where cost exposure concentrates. The scenarios that stress your cost model most reveal where risk management attention should focus.
True manufacturing cost analysis requires looking beyond unit pricing into the complete system of decisions, tradeoffs, and risks that determine what products actually cost to produce. NRE, Component Procurement, test strategy, logistics, and quality investment all contribute substantially to total cost of ownership—often exceeding the unit assembly cost that dominates initial vendor comparisons.
Engineering teams that develop comprehensive cost models before selecting manufacturing partners make better-informed decisions than those chasing the lowest unit price. The vendor that looks most expensive on a spreadsheet often delivers the best outcome when all cost factors enter the analysis.
The goal isn't minimizing cost regardless of quality—it's understanding where money actually goes and investing in the areas that provide genuine value. When you know what drives your manufacturing costs, you can negotiate from knowledge rather than confusion, design from capability rather than assumption, and build products at costs that support both healthy margins and satisfied customers.

A Complete Checklist for Ordering Prototype PCB AssemblyOctober/10/2026

The Rise of AI Servers and Their Impact on HDI PCB AssemblyJuly/10/2026
From Prototype to Mass Production: Scaling Your Hardware StartupSeptember/04/2026

The State of Global PCBA Manufacturing in 2026 and Key TakeawaysMay/22/2026

Supply Chain Resilience: Lessons Learned for PCB Assembly BuyersAugust/06/2026
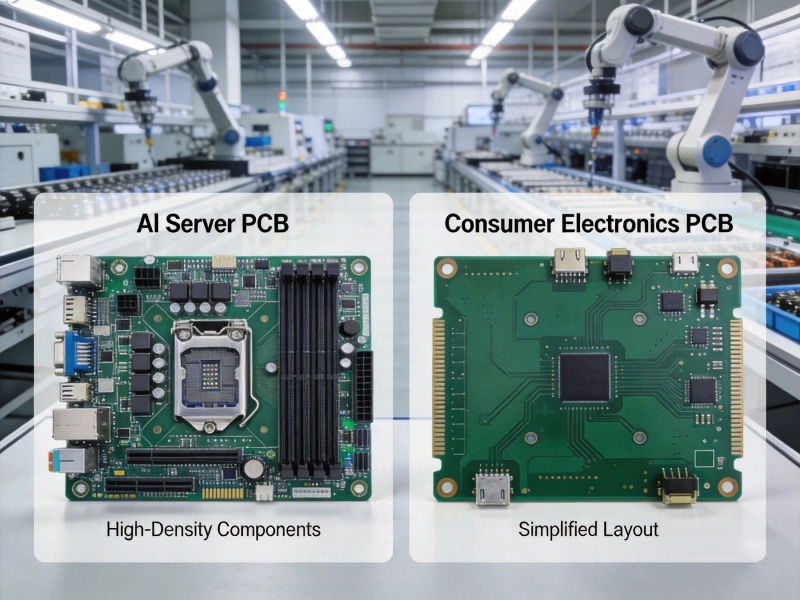
Navigating the Shift: Low-End vs. High-End PCB Assembly MarketsJune/12/2026

Why High-Reliability PCB Assembly is Critical for Medical DevicesMay/22/2026
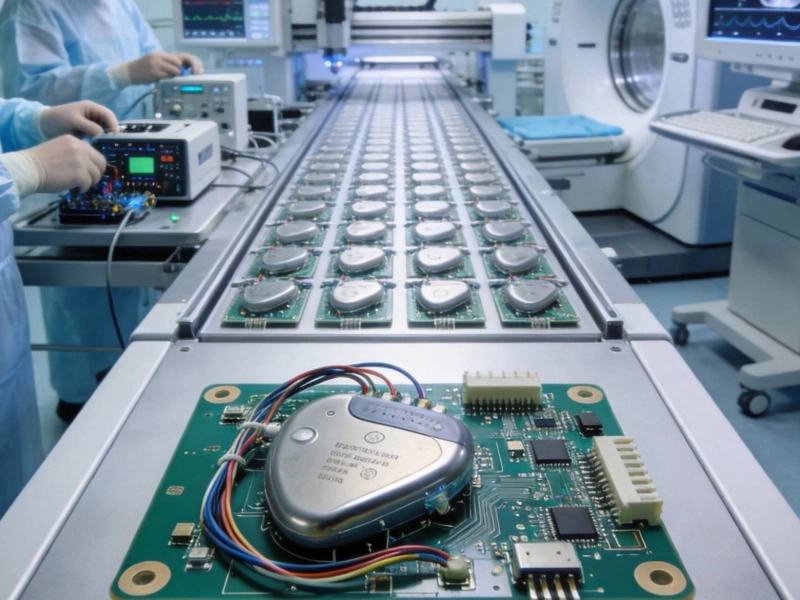
Why High-Reliability PCB Assembly is Critical for Medical DevicesJune/02/2026